

CRM . SALES FEATURE

Sales Pipeline Health: Know If Your Sales Are on Track

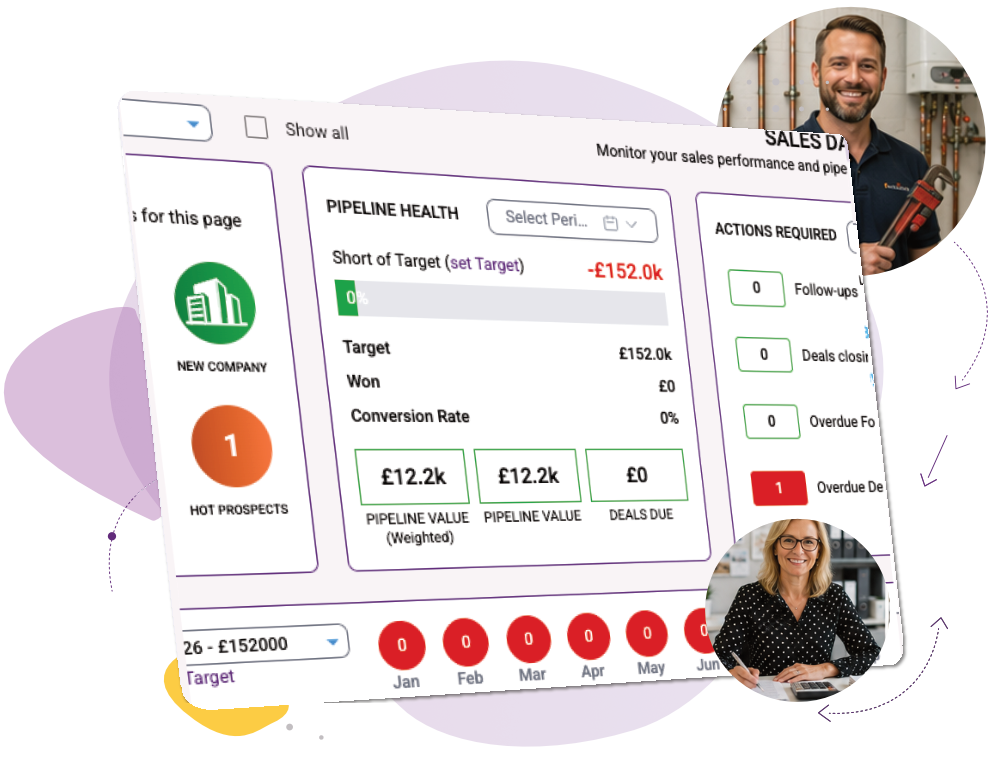
A simple visual snapshot of how your sales pipeline is performing, helping you understand whether your business, salesperson, product or Workspace is on track.
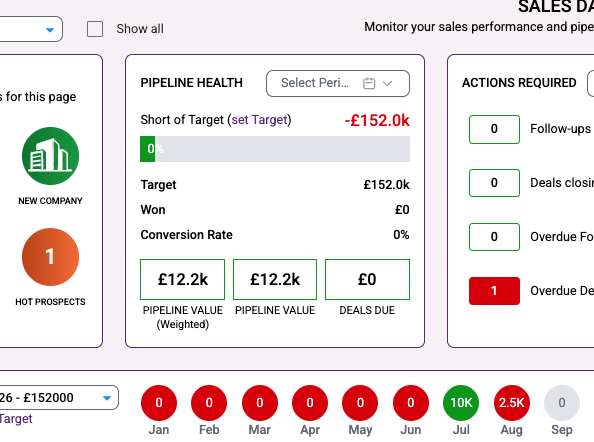
See how you’re performing against target, what you’ve won, your conversion rate and what’s still in the pipeline. Drill into any figure in one click, so you can understand what’s happening and take action without complicated sales reports.

CRM FeaturesSales Features Sales Pipeline Health

What you can do

Know if you're on track

See what you’ve won, how far you are from target and compare performance across individual Workspaces, salespeople, products or services.

Understand what's in your pipeline

See total pipeline value, weighted pipeline value, conversion rate and deals expected to land during the selected period.

Set targets around your business

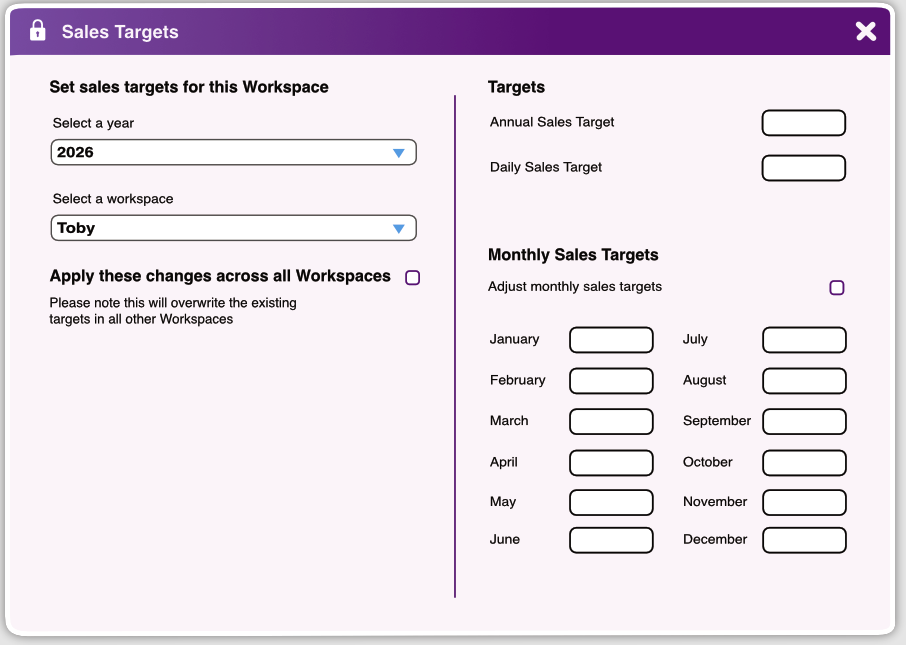
Set individual sales targets for each Workspace, salesperson, product or service, and adjust them month by month to reflect how your business actually sells.

How it works ​

1

Choose what to analyse – Select a Workspace, salesperson or product and the period you want to review.

2

See your Pipeline Health – popcorn uses your deals and opportunities to calculate your key sales performance figures automatically.

3

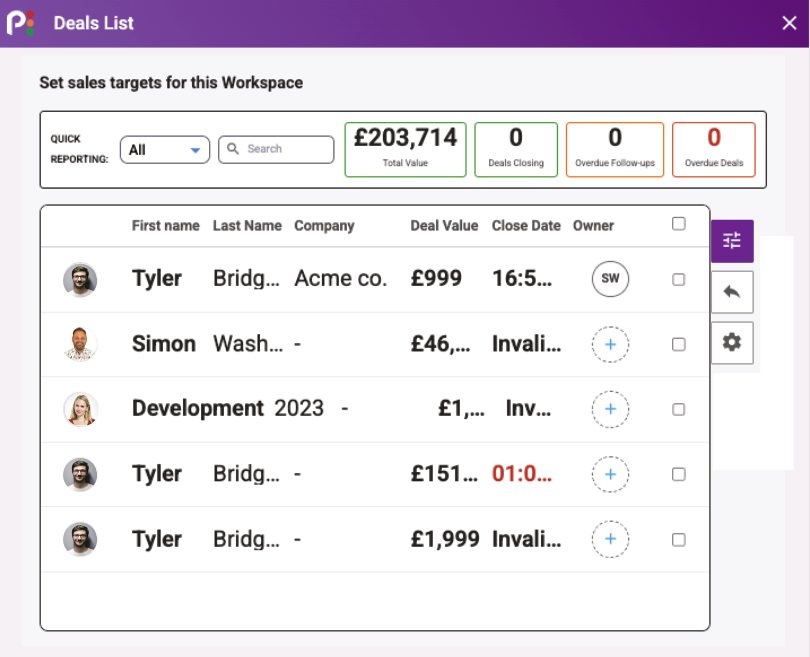
Drill down and act – Click a key statistic to instantly see the opportunities behind the number and identify what needs attention.

“We are in complete control of our prospects and pipeline. popcorn mirrors our business’ sales process – even better – the dashboard, at a glance, tells us how we’re doing.”

Charlotte Thorp, Kinetic Communications

Works Alongside​:

See how these features connect.

Common Quesions

Simple answers to common questions about how popcorn’s Sales Pipeline Health helps small businesses understand performance, targets and the opportunities behind the numbers.
Pipeline Health compares your sales performance with your target, showing what you’ve already won and how far you still have to go during the period you’ve selected.
You can see key figures including value won, conversion rate, total pipeline value, weighted pipeline value and deals due to land during the selected period.

Yes. You can select specific Workspaces, salespeople or products, helping you understand where sales are performing well and where more attention may be needed.

Yes. Select the period you want to review so you can analyse Pipeline Health across the timeframe that’s relevant to you.

Yes. Your dashboard figures aren’t just static statistics. Click through the key metrics to generate the underlying report and see the deals and opportunities behind them.

Know exactly where your sales stand

Book a demo and see how quickly you can find anything about a contact.
Most CRMs bury contact info behind three clicks and a new page load. Popcorn doesn’t. In a personalised demo, we’ll show you the contact popup in action – one click, from anywhere, and everything about that person is right there. Book your demo and see it working on your own contacts, not a generic example.

Or if you’d rather explore first: